`Daily' Graph (5 Minute Average)
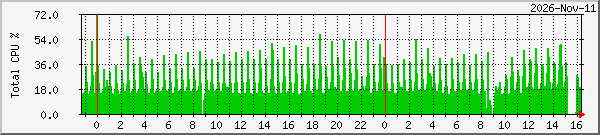
| Max | Average | Current | |
|---|---|---|---|
| Total CPU | 71 % | 22 % | 15 % |
The statistics were last updated Wednesday, 11 November 2026 at 16:25 UTC,
at which time 'GrahamsPC' had been up for 0:32:07.
| Max | Average | Current | |
|---|---|---|---|
| Total CPU | 71 % | 22 % | 15 % |
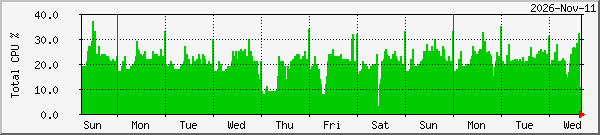
| Max | Average | Current | |
|---|---|---|---|
| Total CPU | 37 % | 21 % | 11 % |
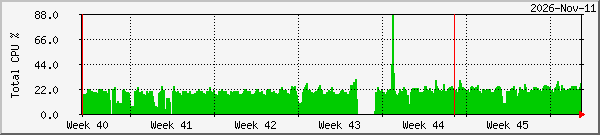
| Max | Average | Current | |
|---|---|---|---|
| Total CPU | 88 % | 19 % | 27 % |
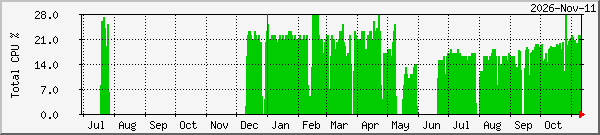
| Max | Average | Current | |
|---|---|---|---|
| Total CPU | 28 % | 17 % | 22 % |
| GREEN ### | Total CPU usage |
|---|


